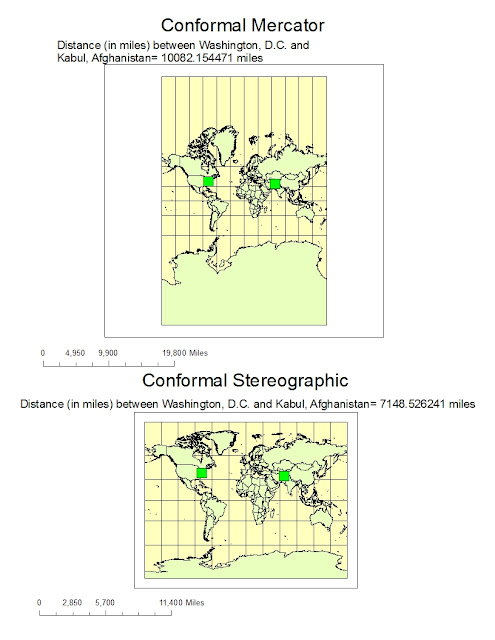
Map projections are significant to portray the surface of the earth or a portion of the earth on a flat surface. There are three main types of projections, which are conformal, equal area, and equidistant. They are based on distortions of conformality, distance, direction, scale, and area. Distortions of these properties are minimized by specific map projections at the expense of making errors in other aspects. For instance, in conformal map projection, the scale of a map at any point on the map is the same in any direction. Meridians and parallels intersect at right angles. Shapes as perfect circles are preserved locally on conformal maps. In this assignment, I quote Mercator as an example of conformal maps. The Mercator projection has straight meridians and parallels, which intersect at right angles. Scale is true at the equator or at two standard parallels equidistant from the equator. The projection is often utilized for marine navigation because all straight lines on the map are lines of constant azimuth. Another example for conformal map projection is Stereographic. Stereographic projections are applied for navigation in Polar Regions. Directions are true from the center point.
As for equal area map projection, a map portrays areas over the entire map so that all mapped areas have the same proportional relationship to the areas on the Earth that they represent. An example is Sinusoidal equal-area maps. They have straight parallels at right angles to a central meridian. Scale is true only on the central meridian and the parallels. The maps are often employed in countries with a larger north-south than east-west extent. Last but not least, equidistant maps are important for portraying distances from the center of the projection to other places on the map. For example, equidistant conic and equidistant cylindrical maps distort direction, area, and shape away from standard parallels. They are used for portrayals of areas near to the equator.
One of the advantages and potentials of using map projections is that they are easy to be used. It is because the only way to get an exact duplication of the Earth is to project the globe from a three dimensional planet to a two dimensional plane. The two dimensional representation is easier to be carried around for the study of geographical information. Another potential of map projections is for commuting and traveling. We can easily collect crucial data to strengthen our understanding of the relationships between places on the Earth. For instance, equidistant conic projections preserve distances on the earth so they are useful for showing directions when commuting. This preservation assists travelers to estimate the resources they will need, such as traveling distance, gas, and time, to efficiently commute between two locations. Consequently, we can make good use of different map projections according to our specific researching purposes. For example, the equal-area Mollweide projections may help researchers to map the areas of urbanization because vicinity is preserved.
However, map projections have pitfalls and perils. The basic problem inherent in any type of map projection is that it will result in some distortion of the ‘ground truth’ of the area being mapped. As we can see in the figure above, large objects in the projection are distorted in the Mercator projection, while Antarctica becomes a huge land mass covering almost half the map.There are four basic characteristics of a map that are distorted to some degree, depending on the projection used. These characteristics involve distance, direction, shape, and area. The only place on a map where there is no distortion is along the trace of the line that marks the intersection of our ‘paper’ with the surface of the earth. Any place on the map that does not lie along this line will suffer some distortion. Therefore, different map projections provide inconsistent information about distance, direction, shape, and area. Essentially, by looking at the Mercator projection, I measured that the distance between Washington D.C. and Kabul is around 10,000 miles while it is only around 5000 miles in the equidistant cylindrical projection. The equidistant cylindrical projection is more reliable because it preserves distances between points on the earth, whereas the conformal Mercator does not preserve distances. Users may get confused if they do not understand the preserved properties of different map projections. Fortunately, depending on the type of projection used, at least one of the four characteristics can generally be preserved. As a result, we should remember to make sure that we are using the right map projection to collect geographical information. If we choose the wrong one, inaccurate data will be found, which will adversely affect our interpretation and analysis of the data. Therefore, we should identify the correct maps and understand their potentials and pitfalls before using them.


